
 Back to All Performance Assessments
 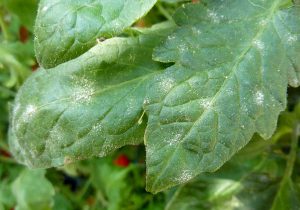 Image copyright: ©CABI (Dr Phil Taylor)
Tomato
 France (Southern)
A combination of biocontrol solutions tested against a conventional strategy for controlling powdery mildew and mites, as well as an untreated control.
Performance assessment
To compare a “conventional” and an “IPM” crop that implements innovations from the ADOPT IPM project
| Common name | Scientific name | Pest type |
|---|---|---|
|
Powdery mildew of tomato |
Pseudoidium neolycopersici |
Fungal diseases |
|
Tomato russet mite |
Aculops lycopersici |
Arthropod Pests |
|
Two-spotted spider mite |
Tetranychus urticae |
Arthropod Pests |
Standard practice:
2 x Bacillus thiuringiensis (Tuta absoluta) 2 x Milbemectin (mites) 1 x difénoconazol+cyflufenamid (treatment at first PM spots)
Macrolophus (whiteflies, Tuta absoluta, mites, aphids)
ADOPT-IPM solution:
Nursery treatment : ANT VA and NT as drench + ANT NT and PT as foliar spray.
In crop ANT VA + TD as drench + ANT NT, PT, KN as foliar spray followed by ANT VA as drench + ANT NT, PTP, KN as foliar spray
Macrolophus (whiteflies, Tuta absoluta, mites, aphids)
Experimental design:
Replications
2 “ADOPT IPM” tunnels + 2 “conventional” tunnels
Plot size
Four 128 m² tunnels
Trial Duration
Planned start date: tomato plantation week 19
Planned end date: week 30
Location
Centre INRAE Provence-Alpes-Côte d’Azur, Domaine Saint Maurice
Unité de Recherche de Pathologie végétale
67, allée des chênes
F84143 Montfavet Cedex, FRANCE
GPS: longitude 4°51’51.56″; latitude 43°56’44.60″
Data collection
Quantification of powdery mildew development following a semi-quantitative scale (ratings only on central rows = 156 plants / tunnel).
• 0: healthy plant
• 1: 1-5 diseased leaves; 1-3 spots / leaf
• 2: 1-5 diseased leaves; 4-10 spots / leaf
• 3: + 5 diseased leaves; 4-10 spots / leaf
• 4: + 5 diseased leaves; + 10 spots / leaf
If possible: measurement of the number of PM spots per leaf (2 leaves per plant for 10 plants per tunnel randomly drawn from 156 plants).
Yield:
• 20 plants per tunnel (randomly drawn from 156 plants)
• Number of harvested ripe fruits per plant
• Individual weight of ripe fruits
Statistical Methods
Analysis of variance or non-parametric tests depending on the type of data, followed by statistical tests to compare means.
Overall Performance
Packages are compared by their Performance (displayed in the bar charts and summarised by the Utility score) and their Pesticide Load Index (PLI). Higher Performance/Utility and lower PLI indicate more favourable results.
Compare Packages
| Package | Utility | Pesticide Load Index |
|---|---|---|
|
Baseline |
86% |
0.06 |
|
ADOPT-IPM |
57% |
0 |
Summary
The CCP had an overall higher utility score than the ADOPT-IPM approach and had superior or equal scores in each category measured. However it had a higher PLI and societal cost compared to the ADOPT-IPM approach although this was relatively modest.
Performance by indicator
Compare Packages
| Package | Utility |
|---|---|
|
Baseline |
95% |
|
ADOPT-IPM |
50% |
Notes
The current commercial practice (CCP) is well established and has been used by growers for many years. There may be small variations between growers but farm advisors gave a picture of their best advice for a general growing season. Some growers may not follow this advice perfectly. Natural variability may also influence efficacy. Interesting results for IPM package but not commercially acceptable at this stage. Early-Mid season yields (Clusters 1-3) were not highly different compared with CCP but the harvest season (Clusters 4-5/6+) was shortened due to PM and mite damage to plantsCompare Packages
| Package | Utility |
|---|---|
|
Baseline |
74% |
|
ADOPT-IPM |
74% |
Notes
Current commercial practice staff are trained in working under protected conditions. Generally H&S conditions are ‘acceptable’ but the confidence is not ‘very high’ because of variability between growers. In the IPM package individual drenching of plants was hard work in protected conditions though in commercial use (not trial conditions) drenching would be done through a fertigation system.Compare Packages
| Package | Utility |
|---|---|
|
Baseline |
74% |
|
ADOPT-IPM |
50% |
Notes
Growers are used to these costs and they are generally acceptable with high confidence. Cost of alternative IPM package treatment is the same as or lower than the current commercial practice according to the manufacturers.Compare Packages
| Package | Utility |
|---|---|
|
Baseline |
74% |
|
ADOPT-IPM |
74% |
Notes
Identical water and fertigation practices between CCP and IPM package so the IPM package was felt to have the same environmental impacts as CCP.Compare Packages
| Package | Utility |
|---|---|
|
Baseline |
74% |
|
ADOPT-IPM |
74% |
Notes
The CCP is well established and has been used by growers for many years. There may be small variations between growers. Natural variability may also influence efficacy. Drenching of individual plants was time consuming although in commercial use (not trial conditions) drenching and other treatments would be done through a fertigation systems and normal application methods. Three foliar spray components need to be measured and combined (ready mixed formulations may help reduce this need).Compare Packages
| Package | Utility |
|---|---|
|
Baseline |
95% |
|
ADOPT-IPM |
50% |
Notes
Well established practices with well understood markets and support for CCP. Presently the products supplied by ANT are not available in commercial markets compared with pesticides. This should be resolved in time. See also: the notes for Time and Management which are related.Pesticide Load Index (PLI)
| PLI Sub-Indicator | Baseline | ADOPT-IPM | Notes |
|---|---|---|---|
| Human Health | 0.04 | 0 |
Pesticide Load Index (PLI) is calculated based on the toxicity and the amount of the active ingredient(s) applied as part of each package. A higher PLI indicates higher risk to the relevant sub-indicator (human health, ecotoxicity or environmental fate). Scale from 0-1.5, with 0 being no impact and 1.5 being the highest impact. CCP Societal costs €1.68/ha For the full breakdown of pesticide load and costs, from the Pesticide Impact Explorer tool developed by Aarhus University, click here. |
| Ecotoxicity | 0.09 | 0 | |
| Environmental Fate | 0.05 | 0 |