
 Back to All Performance Assessments
 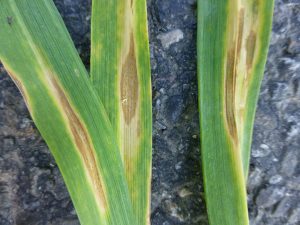 Image copyright: ©CABI (Dr Phil Taylor)
Wheat
 Denmark
Comparison of Current Conventional Practice with an IPM approach for the control of Septoria in wheat
Performance assessment
To demonstrate effective control of Septoria by combining cultivar mixtures and biological control agents/biopesticides.
| Common name | Scientific name | Pest type |
|---|---|---|
|
Septoria leaf blotch |
Zymoseptoria tritici |
Fungal diseases |
Standard practice:
0.75 l/ha Balaya (100 g/l mefentrifluconazole and 100 g/l pyraclostrobin) and 0.75 l/ha Univoq (50g/L Fenpicoxamid and 100g/L Prothioconazole)
at BBCH 37-39 and BBCH 55-61, respectively.
ADOPT-IPM solution:
Integrating cultivar mixture and the application of biopesticide (Thioprone [825 g/l Sulphur])
Experimental design:
Split plot with two factors (A: Cultivar; B: Fungicide)
Factor A: Cultivar mixture
Cultivar mixture consisting of Kvium, Informer, and Pondus)
Pondus alone
Kvium alone
Informer alone
Rembrandt (susceptible standard)
Factor B:
Untreated
Standard practice
Adopt-IPM solution
Replications
Three
Plot size
20 m²
Trial Duration
1 October 2024 – 31 July 2025
Location
Address: Forsøgsvej 1 4200, Slagelse, Denmark
GPS Coordinate: 55.32534 °N, 11.39129 °E
Randomization Procedure
Treatments will be completely randomized in each plot. Randomization will be done with ARM software.
Sample Size Justification
Plot size is standard for fungicide efficacy trials and demonstrations.
Data collection
Disease severity data will be recorded at weekly intervals following the EPPO standard.
Grain yield is measured for each plot. A sample of 1 kg per plot is sampled for quality analysis.
Statistical Methods
A range of statistical methods, both parametric and non-parametric will be considered and the most suitable method will be used to analyse the data.
Overall Performance
Packages are compared by their Performance (displayed in the bar charts and summarised by the Utility score) and their Pesticide Load Index (PLI). Higher Performance/Utility and lower PLI indicate more favourable results.
Compare Packages
| Package | Utility | Pesticide Load Index |
|---|---|---|
|
Baseline |
92% |
0.12 |
|
ADOPT-IPM |
74% |
3.06 |
Summary
The CCP performed slightly better overall especially in the category of crop loss where less yield was lost, however, although fewer fungicides were used, the high use of sulphur resulted in a very high score for the PLI and therefore for societal costs, which would count against use of this approach.
Performance by indicator
Compare Packages
| Package | Utility |
|---|---|
|
Baseline |
98% |
|
ADOPT-IPM |
74% |
Notes
The CCP was judged to have performed better than the ADOPT-IPM package.Compare Packages
| Package | Utility |
|---|---|
|
Baseline |
74% |
|
ADOPT-IPM |
74% |
Notes
Both packages performed equally well in terms of health and safety.Compare Packages
| Package | Utility |
|---|---|
|
Baseline |
98% |
|
ADOPT-IPM |
74% |
Notes
Cost of sulphur is greater than that of CCP.Compare Packages
| Package | Utility |
|---|---|
|
Baseline |
74% |
|
ADOPT-IPM |
74% |
Notes
The CCP and the ADOPT-IPM practices were considered to be equal.Compare Packages
| Package | Utility |
|---|---|
|
Baseline |
98% |
|
ADOPT-IPM |
74% |
Notes
Although the treatment was the same (hydraulic spraying) the biopesticide product was less familiar and required greater care in mixing and application.Compare Packages
| Package | Utility |
|---|---|
|
Baseline |
98% |
|
ADOPT-IPM |
74% |
Notes
ADOPT-IPM treatment is a little less widely used so requires greater coordination with chemical supplier.Pesticide Load Index (PLI)
| PLI Sub-Indicator | Baseline | ADOPT-IPM | Notes |
|---|---|---|---|
| Human Health | 0.08 | 1.08 |
Pesticide Load Index (PLI) is calculated based on the toxicity and the amount of the active ingredient(s) applied as part of each package. A higher PLI indicates higher risk to the relevant sub-indicator (human health, ecotoxicity or environmental fate). Scale from 0-1.5, with 0 being no impact and 1.5 being the highest impact. CCP Societal costs €3.26/ha For the full breakdown of pesticide load and costs, from the Pesticide Impact Explorer tool developed by Aarhus University, click here. |
| Ecotoxicity | 0.18 | 4.86 | |
| Environmental Fate | 0.08 | 3.25 |