 Image copyright: CABI
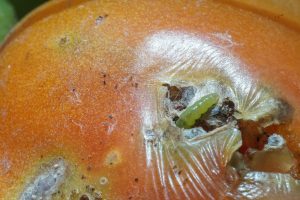
Tomato
Impact of planting alternative plant strips in tomato greenhouse to support biocontrol against Tuta absoluta
Performance assessment
Testing the potential of selected alternative plants (Sesamum indicum and Verbena x hybrida) to improve BCAs and biocontrol services provided by the predator Nesidiocoris tenuis against the key pest Tuta absoluta in tomato commercial greenhouses.
| Common name | Scientific name | Pest type |
|---|---|---|
|
South American tomato pinworm |
Tuta absoluta |
Arthropod Pests |
- Standard practice: ‘control’ greenhouse where the usual growers’ practice are implemented for controlling the target pest
- Adopt-IPM solution: ‘treated’ greenhouse where alternative plant strips are established along tomato plants
Alternative plants are established inside the greenhouse together (at the same time of transplanting) with tomato plants. Plots consist of 5 tomato plant rows alone or combined with a row of alternative plants. Treatments include (i) tomato alone, (ii) Sesamum indicum + tomato, (iii) Verbena x hybrida + tomato, (iv) mix of S. indicum / Verbena x hybrida + tomato
Replications
4
Plot size
75 m2
Trial Duration
Planned start date: September 2024
Planned end date: May 2025
Location
Commercial greenhouses provided by Econatura Group, Ragusa, Sicily, Italy (36°48’03″N 14°35’11″E)
Sample Size Justification
Each row of 15 meters long, and the monitoring/samplings are made within 5 meters from the row of alternative plants, thus the plot is about 75 m2
Data Collection
The level of infestation (percentage of infested plants and number of individuals per tomato plant) by Tuta absoluta as well as the number of Nesidiocoris tenuis individuals occurring on tomato plants and alternative plants along different treatments will be assessed every two weeks
Statistical Methods
Depending on the obtained dataset, data will be analysed by means of analysis of variance (ANOVA) or if not possible (if the data will not fulfil the ANOVA assumptions) by means of nonparametric tests (i.e., Kruskal–Wallis test followed by Dunn’s post hoc test) in order to conduct multiple mean comparisons among treatments
Overall Performance
Packages are compared by their Performance (displayed in the bar charts and summarised by the Utility score) and their Pesticide Load Index (PLI). Higher Performance/Utility and lower PLI indicate more favourable results.
Compare Packages
| Package | Utility | Pesticide Load Index |
|---|---|---|
|
Baseline |
66% |
- |
|
Adopt-IPM |
74% |
- |
Summary
The ADOPT-IPM package had a marginally higher overall utility to the Current Commecial practice (CCP). Although the losses in the ADOPT package were slightly high than CCP, the benefits from the remaining indicators were sufficiently high to make the package perform better overall.
Performance by indicator
Compare Packages
| Package | Utility |
|---|---|
|
Baseline |
74% |
|
ADOPT-IPM |
70% |
Notes
For CCP, the current approach usually ensures low production losses. For the ADOPT system, this IPM package is relatively new so confidence is lower than for CCP as there is lower understanding of natural variation and knowledge-based dimensions of confidence. With more trials this confidence could increase.Compare Packages
| Package | Utility |
|---|---|
|
Baseline |
74% |
|
ADOPT-IPM |
98% |
Notes
In CCP, no significant physical concerns however higher acceptability was not selected because of working in high temperature environments. For the ADOPT package, operator risks are less because of lower monitoring and biopesticide applications requirements which lowers the need for human presence in high temperature plastic tunnels. There are lower management requirements compared with CCP because companion plants require little or no attentionCompare Packages
| Package | Utility |
|---|---|
|
Baseline |
50% |
|
ADOPT-IPM |
50% |
Notes
For CCP, application and biopesticides costs are expensive (Azadiractin, in particular). Multiple days required to spray crops because the operational temperature window is narrow. For the ADOPT package, application costs of Bt. and planting costs of companion plants is significant. Companion plants require some extra irrigation in the early part of the season (2-3 weeks in an eight month tomato-crop cycle). Sacrificed growing area (3% of tomato area) reduces production. Medium confidence reflects access to companion plant seeds currently. In the future, this cost will be greatly reduced with local production of Sesame plants for tomato growers. Verbena plants are already available locally. The costs of plants will reduce so rating of acceptability will increase alongside confidence in the future.Compare Packages
| Package | Utility |
|---|---|
|
Baseline |
74% |
|
ADOPT-IPM |
95% |
Notes
For ADOPT IPM, the negative environmental impact of protected cropping is reduced relative to CCP because of biodiversity improvements. The companion plants attract other natural enemies e.g. Syrphids. Old companion plants can be incorporated into the soil to improve soil structure.Compare Packages
| Package | Utility |
|---|---|
|
Baseline |
50% |
|
ADOPT-IPM |
74% |
Notes
For CCP, making decisions about when to apply insecticides and to select the right products and apply them, depends on pest densities which require a lot of time. Confidence is Medium because of variation between growers and farms. For the ADOPT package, less monitoring, fewer pesticide applications and a zero re-entry period to the greenhouse after the Azadiractin application is not necessary which frees up time for harvesting, etc.Compare Packages
| Package | Utility |
|---|---|
|
Baseline |
27% |
|
Adopt-IPM |
74% |
Notes
For CCP, biopesticide usage requires coordination to ensure scouting is available when needed which may draw on external resources. For ADOPT, less coordination is required because zero Azadirchtin treatments which provides more time and flexibility to coordinate Bt applicationsPesticide Load Index (PLI)
| PLI Sub-Indicator | Baseline | ADOPT-IPM | Notes |
|---|---|---|---|
| Human Health | 40 | 5 |
Pesticide Load Index (PLI) is calculated based on the toxicity and the amount of the active ingredient(s) applied as part of each package. A higher PLI indicates higher risk to the relevant sub-indicator (human health, ecotoxicity or environmental fate) |
| Ecotoxicity | 30 | 30 | |
| Environmental Fate | 10 | 80 |