
 Back to All Performance Assessments
 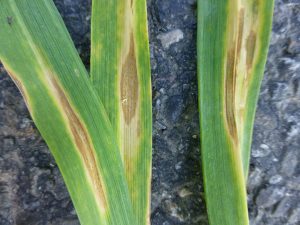 Image copyright: ©CABI (Dr Phil Taylor)
Wheat
 Belgium
Assessing innovative microbial and biomolecule-based crop protection under field conditions against fungal diseases and insect pests in wheat.
Performance assessment
Assessment of the biostimulant and biocontrol effect (against fungal diseases, insect pests and their natural enemies) of microbial consortia (co-culture of Bacillus, Trichoderma and nitrate) as well as antifungal biomolecule (lipopeptide produced by Bacillus sp.) in comparison with other chemical or biobased foliar treatments in winter wheat.
| Common name | Scientific name | Pest type |
|---|---|---|
|
Septoria leaf blotch |
Zymoseptoria tritici |
Fungal diseases |
|
Glume blotch of wheat |
Stagonospora nodorum |
Fungal diseases |
|
Yellow rust |
Puccinia striiformis |
Fungal diseases |
|
Brown rust |
Puccinia triticina |
Fungal diseases |
|
Cereal aphids |
|
Arthropod Pests |
Standard practice:
Conventional Current Practice
ADOPT-IPM solution:
Lipoproteins with biopesticides or chemicals
Experimental design
Completely randomized blocks
Replications
4 (2023-2024) and 5 (2024-2025)
Plot size
8 x 2 m
Trial Duration
Different treatments were tested under field conditions during 2023-2024 and 2024-2025 growing seasons.
Randomization Procedure
Completely randomized blocks
Data collection
Routinely used procedure for foliar disease scoring or insect counting. Four types of observations were conducted during the field trials: phenological development, progression of fungal diseases, monitoring of pest populations, and grain yield at harvest.
Phenological monitoring, essential for determining the optimal timing of fungicide applications, was carried out according to the technical recommendations of the Arvalis Fongiscope guidelines. The BBCH scale (Biologische Bundesanstalt, Bundessortenamt und Chemische Industrie), a standardized and universally accepted system for describing crop developmental stages (Lancashire et al., 1991), was used. Each principal growth stage (0–9) is subdivided into ten secondary stages, resulting in a two-digit code. In this study, observations were conducted from BBCH stage 31 (second node detectable) to BBCH stage 75 (medium milk stage). Sampling was performed in the lateral strips of the plots in order to avoid interference with yield measurements. Five main stems per plot were collected, corresponding to 20 stems per treatment in 2024 and 25 in 2025.
After determination of the phenological stage, each stem was dissected to assess the level of fungal infection according to standard EPPO assessment scales. Three diseases were monitored: Septoria tritici blotch, yellow rust, and brown rust. Disease severity was visually scored on leaves F1 to F5 using the scale described by Koyshibayev and Muminjanov (2016). The results highlight differences in varietal resistance (Livre Blanc Céréales, 2021). The cultivar ‘Mentor’ exhibits moderate susceptibility to brown rust (6.4) and Septoria tritici blotch (6.0), but good tolerance to yellow rust (8.5). In contrast, the cultivar ‘Winner’ shows greater resistance to brown rust (7.5) and yellow rust (8.8), but increased susceptibility to Septoria tritici blotch (5.6).
Entomological monitoring consisted of counting pest and beneficial arthropod populations on 20 randomly selected stems per plot. The survey included aphids, mummified aphids, lady beetles, and parasitoids. Assessments were conducted prior to treatment application, immediately after application, and subsequently at regular intervals until BBCH stage 71 (early grain development). Finally, yields were measured at harvest and expressed in quintals per hectare (q ha⁻¹). Observations were interpreted in relation to climatic conditions, particularly cumulative precipitation (mm) and mean temperature, recorded throughout the trial period using the PAMESeb network of the CRA-W, Gembloux reference station.
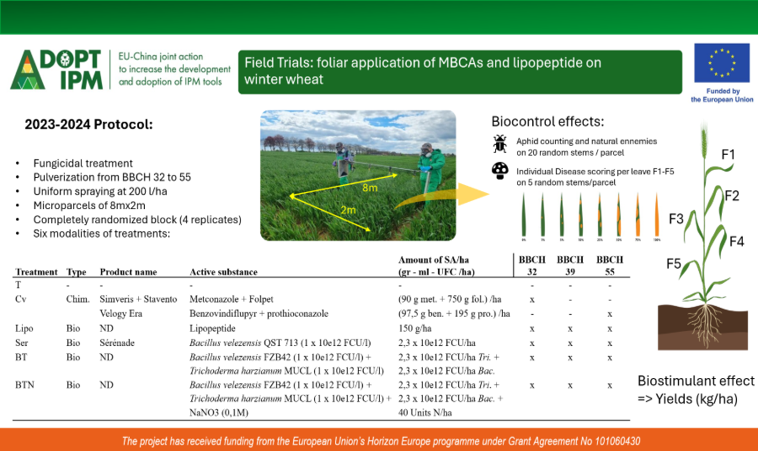
Field trials: 2023-2024 Protocol
© University of Liège
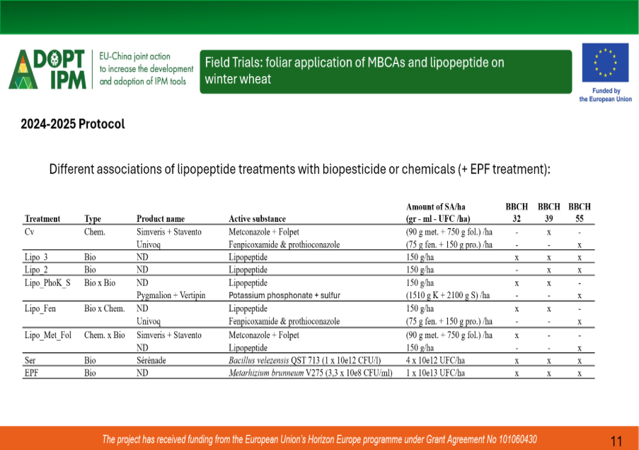
Field trials: 2024-2025 Protocol
© University of Liège
Overall Performance
Packages are compared by their Performance (displayed in the bar charts and summarised by the Utility score) and their Pesticide Load Index (PLI). Higher Performance/Utility and lower PLI indicate more favourable results.
Compare Packages
| Package | Utility | Pesticide Load Index |
|---|---|---|
|
Baseline |
92% |
1.47 |
|
ADOPT-IPM |
46% |
0.82 |
Summary
The overall utility of the ADOPT-IPM was significantly poorer than for the current commercial practice. The lower yield counted heavily against the ADOPT package as did the direct costs of the programme. Lesser impacts came from the need for greater coordination and environmental impact from a greater number of applications of the biopesticide. The PLI and societal costs for both approaches were significant but the CCP was nearly twice as great as the ADOPT-IPM approach.
Performance by indicator
Compare Packages
| Package | Utility |
|---|---|
|
Baseline |
98% |
|
ADOPT-IPM |
27% |
Notes
The losses of the ADOPT package were judged to be significantly lower and would therefore have an adverse effect on uptake.Compare Packages
| Package | Utility |
|---|---|
|
Baseline |
70% |
|
ADOPT-IPM |
70% |
Notes
Both packages performed equally well in terms of health and safety.Compare Packages
| Package | Utility |
|---|---|
|
Baseline |
98% |
|
ADOPT-IPM |
50% |
Notes
In CCP cost of pesticides were generally low compared to the benefits from their application. The biopesticide cost was considerably higher.Compare Packages
| Package | Utility |
|---|---|
|
Baseline |
95% |
|
ADOPT-IPM |
74% |
Notes
The environmental impacts of the ADOPT package was thought to be higher as extra applications resulted in increased emissions from tractors and more soil compaction.Compare Packages
| Package | Utility |
|---|---|
|
Baseline |
74% |
|
ADOPT-IPM |
74% |
Notes
Both packages performed equally well in terms of time and management on farm.Compare Packages
| Package | Utility |
|---|---|
|
Baseline |
95% |
|
ADOPT-IPM |
70% |
Notes
It was thought that greater coordination with outside organisations would be required to ensure that the biopesticide was still active due to a shorter shelf life and the general availability of a new product might be lower.Pesticide Load Index (PLI)
| PLI Sub-Indicator | Baseline | ADOPT-IPM | Notes |
|---|---|---|---|
| Human Health | 1.12 | 0.48 |
Pesticide Load Index (PLI) is calculated based on the toxicity and the amount of the active ingredient(s) applied as part of each package. A higher PLI indicates higher risk to the relevant sub-indicator (human health, ecotoxicity or environmental fate). Scale from 0-1.5, with 0 being no impact and 1.5 being the highest impact. CCP Societal costs €44.44/ha For the full breakdown of pesticide load and costs, from the Pesticide Impact Explorer tool developed by Aarhus University, click here. |
| Ecotoxicity | 1.94 | 0.98 | |
| Environmental Fate | 1.34 | 0.98 |